 NeuroExpresso
NeuroExpresso


Using NeuroExpresso.org
This application aims to facilitate visualization of the data contained in the NeuroExpresso database. The images show screenshots of the application with numbered annotations. Here we explain what each part of the application do, referencing them with the number they are marked with
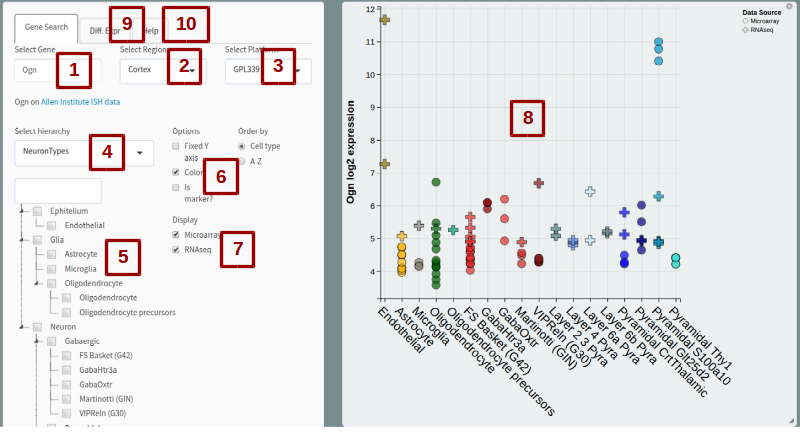
1. Select Gene
Write the official symbol of the gene of interest. If a gene that is not included in the data is entered, suggestions will appear under the box ("Did you mean:..."). If what you enter is a synonym for an official symbol, you will also see suggestions (Synonym of:...). This section also gives a link to Allen Institute mouse ISH data for the gene.
2. Select Region
Select brain region of interest. Selecting a brain region will display cell types isolated from said brain region. Astrocytes and oligodendrocytes are exceptions to this. Since we were unable to find expression data from region specific glial cells yet we knew they were prevelant throughout the brain, they were added to all brain regions unless there is a region specific alternative (Bergmann glia replaces astrocytes in Cerebellum). Note that some regions are subsets of each other.
3. Select Platform
The data included in NeuroExpresso compiled from multiple independent studies. It includes data generated using GPL339 and GPL1261 microarray chips along with single cell RNA-seq data generated by Tasic et al. The genes included in the GPL339 platform is a subset of genes included in GPL1261, while RNA-seq data from Tasic et al. provides the highest covarage of genes. Choosing GPL339 will show expression in all samples included in NeuroExpresso. Choosing GPL1261 will include samples generated using GPL1261 and RNA-seq data by Tasic et al., while increasing the genes avaiable for query. Finally Choosing RNAseq will only show RNA-seq data while making all genes detected in the dataset available for querying. If a gene you entered is available in a larger platform, you will recieve a notification below the "Select Gene" box
4. Select hierachy
This option allows to choose if you want to split samples by cell types or different studies. Implented as a way to detect study specific biases
5. Tree selection
This shows the hierarchical tree specified by "Select Hiearchy" box. By checking the boxes you can control which samples do you want to display or how do you want to group them together in the hierarchy (eg. checking neurons will add a neuron group to the plot, including all neuronal subtypes).
6. Options
These options allow you to customize the plot and get additional information. Fixed axis option makes the axis ranges constant between all plots to allow easier comparison of expression values between genes. Color option removes cell type colors from samples. "Is marker?" option shows if the gene you are looking at was identified as a marker gene based on our study.
7. Display
Use if you not want to display Microarray and RNA-seq data together. Note that RNA-seq data in this visualization is normalized to be on the scale of microarray data. To get the real expression values, please refer to the original data source.
8. The plot
The plot shows expression of all samples (in the case of RNA-seq data clusters) for the choosen gene. You can get more information about a particular sample by clicking on the points. The plot can be resized from the bottom-right corner and an image can be downloaded using the gear icon on the upper-right corner.
9. Differential expression
This tab allows you to assign samples into two groups to run a basic differential expression analysis. You pick samples by drawing a box around them on the plot and clicking to "Save group" button. If no samples are selected when the button is pressed, all samples on display are assigned to the group so you can use other sample filtering methods to pick your samples.
10. Help page
You are here.
Sharing with query strings
You can share links to specific genes using query strings. Gene, region and platform boxes can be filled this way.
http://neuroexpresso.org/?gene=Eno2®ion=Midbrain&platform=GPL1261NeuroExpresso data and marker genes
The data in NeuroExpresso compiled as part of a project aiming to select marker genes for mouse brain cell types and calculate marker gene profiles.
The data in neuroexpresso and marker genes identified in the study can be accessed here.
R package for calculation of marker gene profiles can be found here.
How to cite
If using NeuroExpresso or the data provided, please cite:
B. Ogan Mancarci et al., “Cross-Laboratory Analysis of Brain Cell Type Transcriptomes with Applications to Interpretation of Bulk Tissue Data,” ENeuro, November 20, 2017, ENEURO.0212-17.2017, https://doi.org/10.1523/ENEURO.0212-17.2017.Contact
If you have questions or problems, mail Ogan Mancarci . Please mention NeuroExpresso by name to ensure avoiding spam detectors
To report bugs, open an issue on the github repo